
Perform an optimisation exercise
Either in conjunction with or separately from the built-in Prioritisation feature, your organisation can use this Strategic Optimisation capability in Altus to:
- Plan initiatives more strategically and efficiently.
- Adapt quickly to changing business needs through flexible scenario planning.
- Make informed, data-driven decisions aligned with organisational goals.
- Analyse financial impacts and manage budget constraints effectively.
- Explore multiple "what-if" scenarios before committing to a final plan.
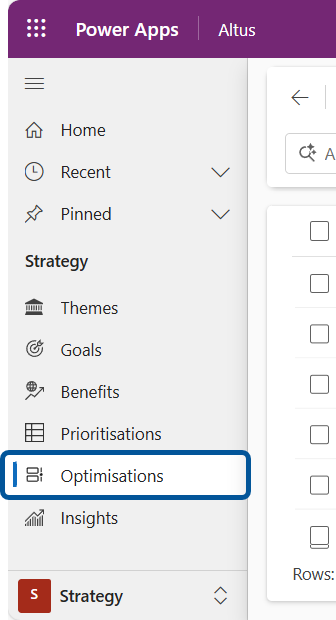
This exercise is ideal for teams looking to enhance their planning process with deeper insights and greater adaptability. Optimisations can be found in the Altus Strategy area.
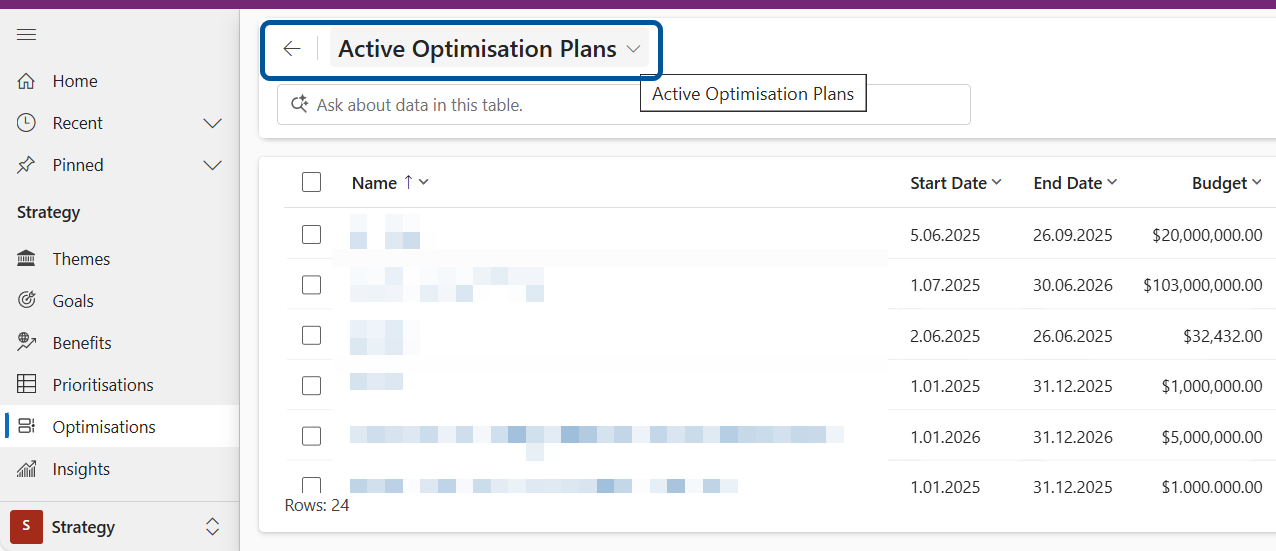
The Active Optimisation Plans view lists all the optimisation plans created for your organisation.
A. Creating a New Optimisation Plan
- Navigate to the Active Optimisation Plans view.
If an Optimisation Plan already exists, click its name in the view to open and review it.
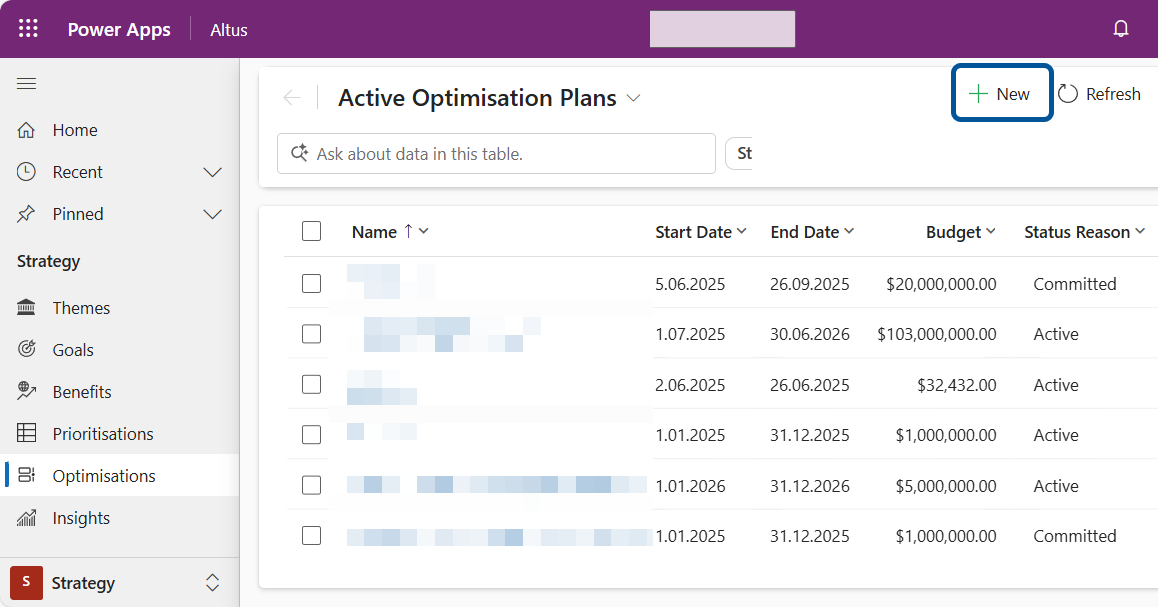
- Click +New in the command bar to open the plan creation form.
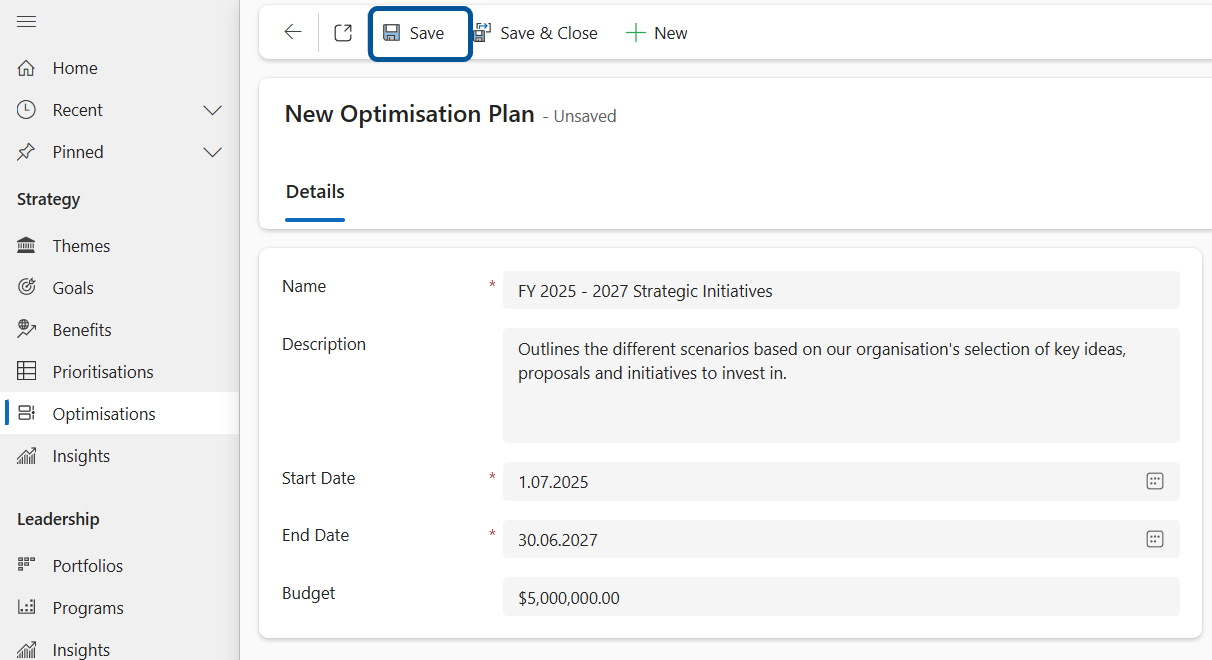
| Field | Description |
|---|---|
| Name | The name of your Optimisation Plan. |
| Description | (Optional) A description of your Optimisation Plan. |
| Start Date | (Required) The start date of the planning window. This cannot be changed after saving. |
| End Date | (Required) The end date of the planning window. This cannot be changed after saving. |
| Budget | The budget allocated to this Optimisation Plan. |
- Enter a unique name for your optimisation plan.
- Provide a brief description of the plan.
- Specify the start and finish dates—this defines the timeframe for strategic initiatives.
- Enter the budget amount—the total budget you expect to allocate across initiatives during the selected date range.
- Click Save to activate the creation and management of "what-if" scenarios.
B. Creating Scenarios within an Optimisation Plan
Each Optimisation Plan can include multiple Scenarios. Scenarios allow you to explore different sets of Initiatives within the same planning window and budget.
Note: The parent Optimisation Plan always dictates the horizon planning window (start and end dates) and the Budget allocated to the Plan.
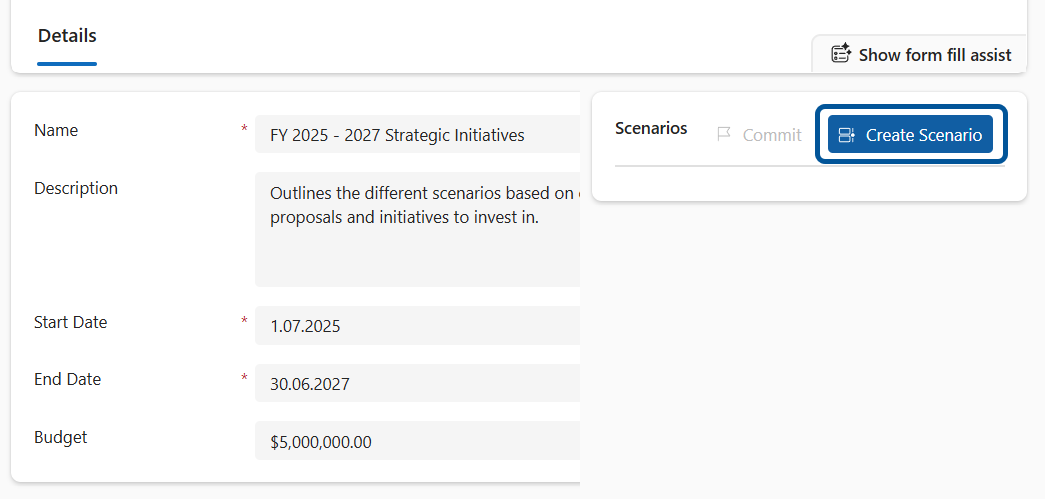
- Open the Scenarios Pane. In your optimisation plan, go to the Scenarios pane and click Create Scenario to open the new scenario form.
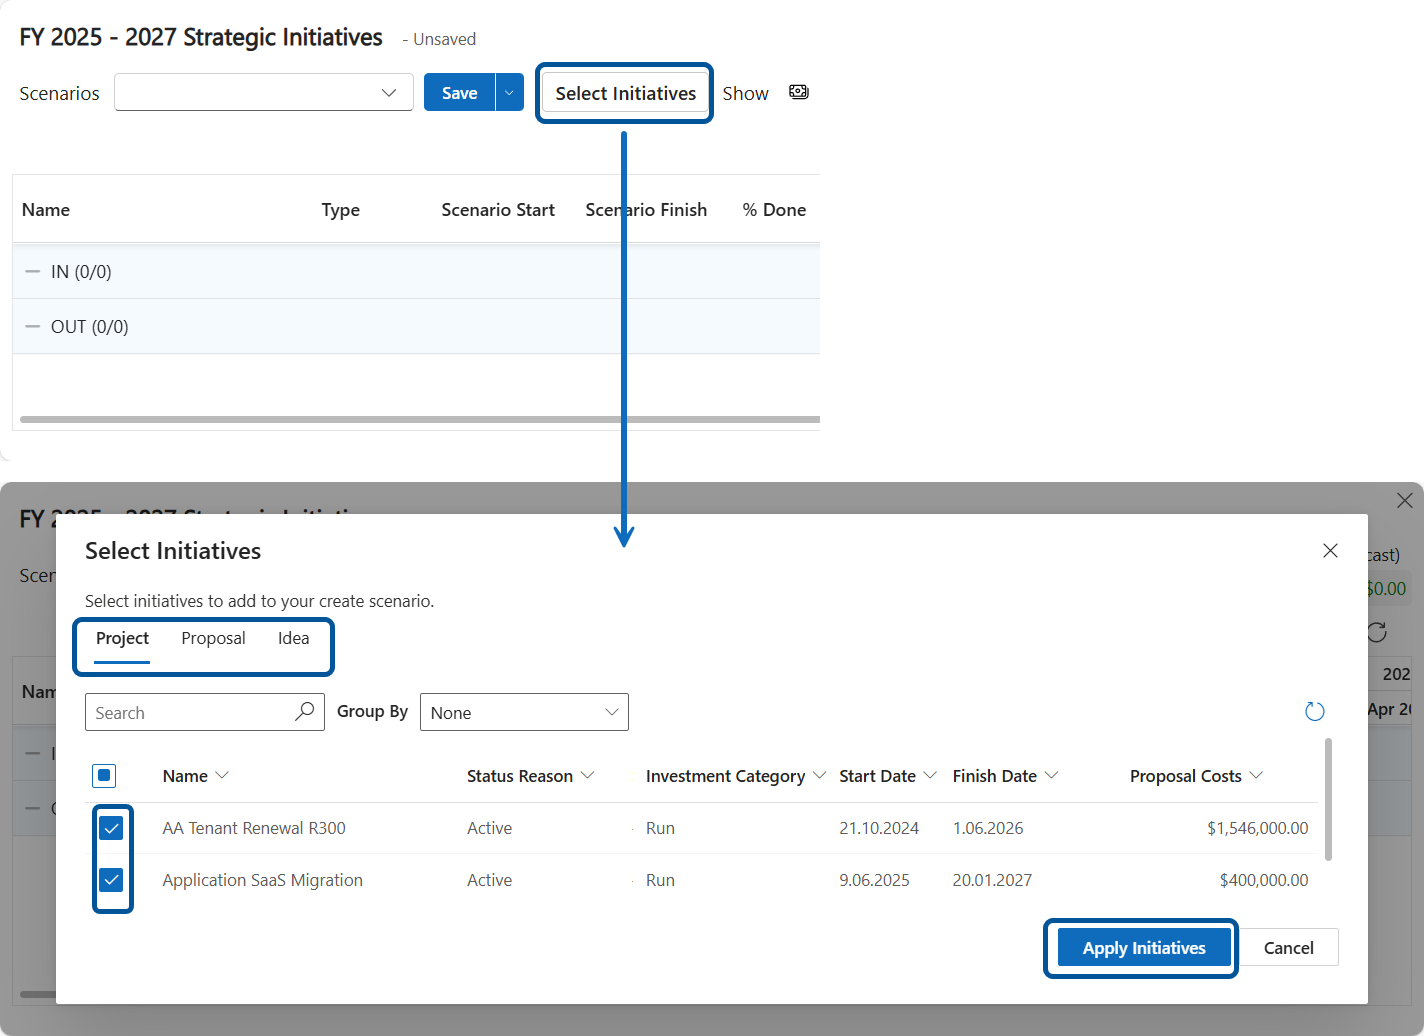
- Select Initiatives. In the scenario pop-up window, click Select Initiatives and choose the projects, proposals, and/or submitted ideas you want to include in the scenario, based on your defined date range and budget.
- The Initiative selection dialog will appear, allowing you to choose Initiatives to include or exclude.
- Initiatives are grouped by type, as defined in your configuration settings (shared with the Prioritisation feature).
- Switch between tabs to select multiple Initiatives of different types, then click Apply Initiatives to update your Scenario.
Each Scenario can include a different set of Initiatives.
3. Review Budget Constraints vs Forecast Cost: Once initiatives are added, review the total forecast cost of the initiatives within the set horizon against your budget constraints. Use this comparison to decide which initiatives to keep or move out of the scenario.
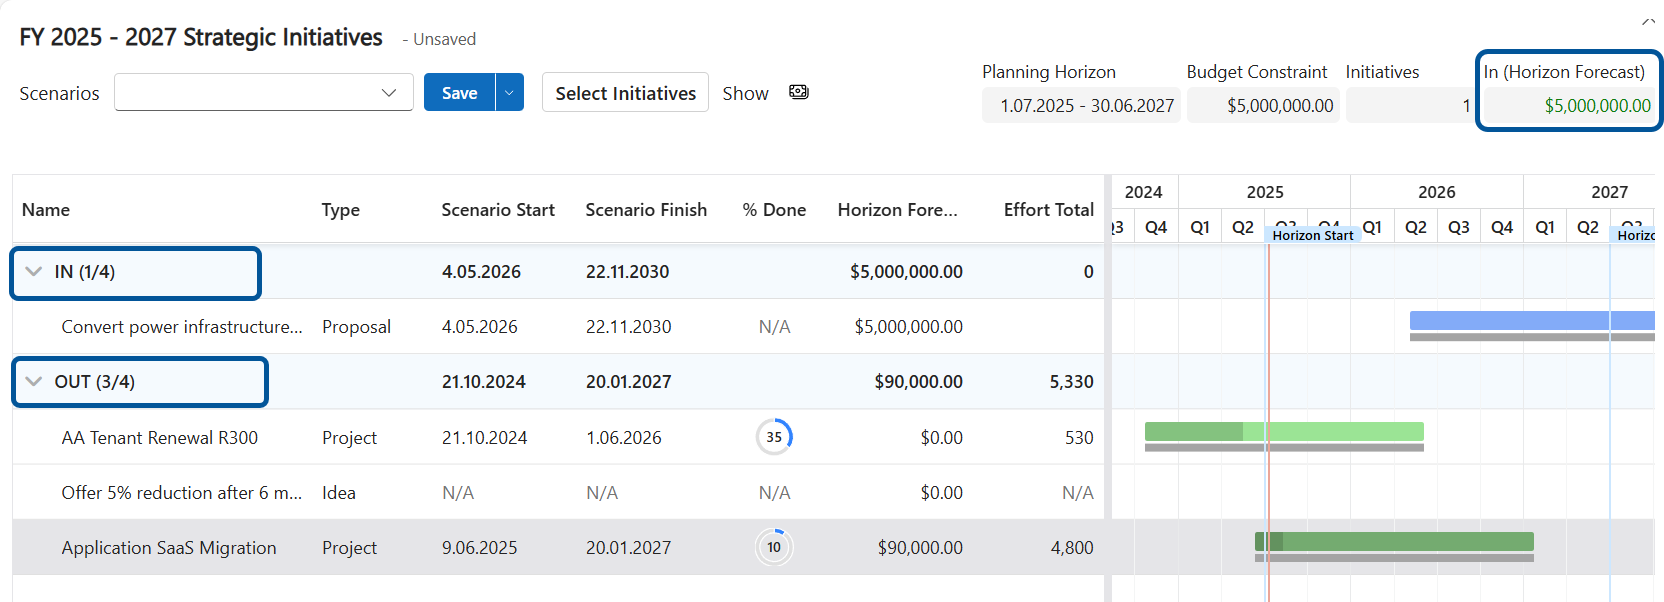
4. Adjust the Scenario ("What-If" Planning). Drag and drop initiatives to the Out list to reduce the total forecast cost aiming to bring the forecast within or under the set budget constraint.
Note: Observe real-time updates to the forecast total as you move initiatives in or out and continue adjusting until the scenario meets your desired budget and planning conditions. The budget constraint value cannot be changed once the scenario is saved. To use a different budget, you must create a new scenario.
Optimise: Move IN/OUT - Initiatives under the IN group are included in your Scenario.
- Initiatives under the OUT group are excluded.
- Move Initiatives between IN and OUT to explore different "what if" scenarios.
- Drag Initiatives in the Gantt chart to simulate changes to their start date.
- Any Initiative in the OUT group is not counted in the Initiatives count, the In (Horizon Forecast) widget, the Optimisation Financial Grid or the Optimisation Resource Grid.
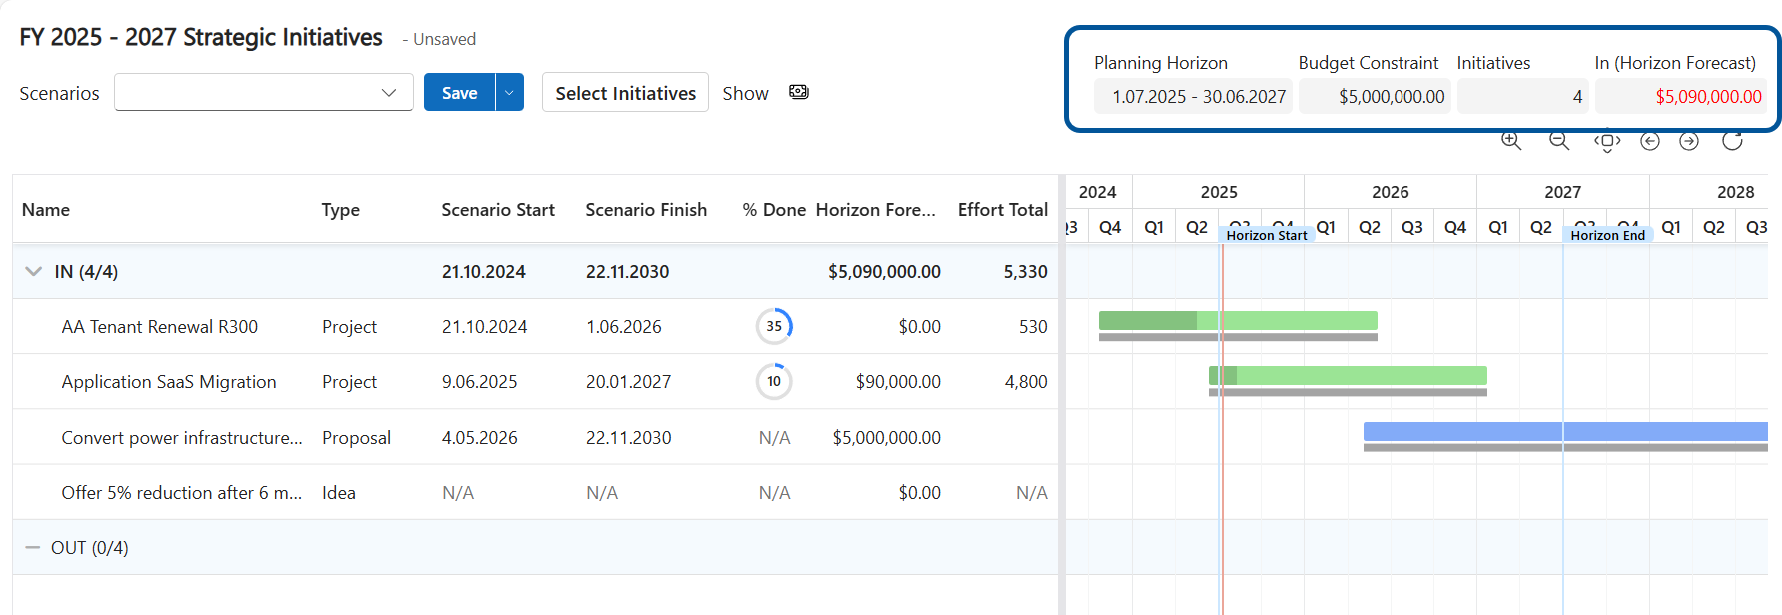

The Optimisation Plan displays four summary widgets:
| Widget | Description |
|---|---|
| Planning Horizon | The date range covered by your plan. |
| Budget Constraint | The budget allocated to your plan. |
| Initiatives | The count of ‘IN’ Initiatives. |
| In (Horizon Forecast) | The total forecast for all ‘IN’ Initiatives (green if under budget, red if over). |
Gantt Timeline Changes
- You can simulate changing the start date of an Initiative, but not its duration.
- The grey line shows the original schedule; the blue bar shows the simulated start.

- These changes are for scenario planning only and do not update the actual Initiative dates.
- For non-Project Initiatives, if any part of the Initiative falls within the planning horizon, its full cost is included in the forecast.
- Simulating date changes can affect the Horizon Forecast value.
- If there are dependencies between Initiatives, you can visualise how date changes impact those dependencies.
Note: Financial data for Projects may sometimes be forecast outside the scheduled dates. If an Initiative is ‘IN’, its financials may still be counted in the forecast even if its simulated dates are outside the planning horizon.
Budget Constraint & Financial Impact
- Show or hide the Financial Grid below the Gantt by toggling the Financial Grid button.

- The Financial Grid displays each ‘IN’ Initiative and its financial transaction types.
- For Projects, financial data is aggregated monthly.
- For Initiatives without time-phased data, only totals are shown.
- Simulated date shifts in the Gantt will also shift financial data in the grid, but only for transaction types that allow it.
- No source financial data is changed by using the Optimisation Plan—simulated shifts are for consideration of the impact only.
Resourcing Constraints & Impact
- Show or hide the Resource Grid below the Gantt by toggling the Resource Grid button.

- The Resource Grid displays one row per Resource Role referenced by the selected IN Initiatives. This includes:
- Resource Requests for Generic Resources, and
- Resource Requests for Named Resources.

- Any Named Resources without an identified Primary Role are grouped under the Unclassified Role.
- Resource view options (via the View ribbon menu):
- Data mode: Proposed or Committed
- Metric: FTE, Hours, or Days

Additional views:
- View resourcing by project: select one or more projects to display their resourcing requirements.

- View project assignments by resource: select one or more resource roles to see their assigned projects.

How the Resource Grid is calculated
- The time-phased values represent the net capacity for a resource role: Net capacity = (available capacity for the role) − (requests for the role across all IN Initiatives) − (requests for the role across other organisation projects/proposals not included as OUT).
- Interpretation:
- Positive value: capacity exceeds requests.
- Negative value: requests exceed capacity.
Simulation behaviour
- To simulate not doing an Initiative, move it from IN to OUT. If the last Initiative referencing a Role is moved to OUT, that Role will no longer appear in the Resource Grid.
- Dragging an IN Initiative in the Gantt simulates a new start date: the Initiative's resource requests shift in the Resource Grid to the corresponding periods (this includes requests that fall in the past).
- All Resource Requests for a moved Initiative will simulate the shift.
- Cells are shaded using the same colour scheme as Resource Heatmaps to indicate capacity versus utilisation.
- Cells outside the configured Resource Horizon show an icon indicating no capacity data is available.
Colour / heatmap examples
- Blue (non-zero): Role exists but has no requests for the period (capacity available).

- Blue (0): No resources are associated to that Role for the period.

- Blue-green: Proposed requests exist but capacity remains for the period.

- Green: Requests are close to but do not exceed capacity (e.g., 0.66 FTE remaining).

- Red: Requests exceed capacity (e.g., requests exceed capacity by 0.78 FTE).

- Icon: Period outside Resource Horizon — no capacity calculation possible.

Important: No source resource data is changed by using the Optimisation Plan — simulated shifts are for evaluation only.
Note: The Resource Grid and Financial Grid are mutually exclusive in the UI. Showing one will hide the other.
5. Save the Scenario. Once your scenario aligns with the budget and planning goals, click Save. This saves the scenario for future reference, comparison, or reapplication.
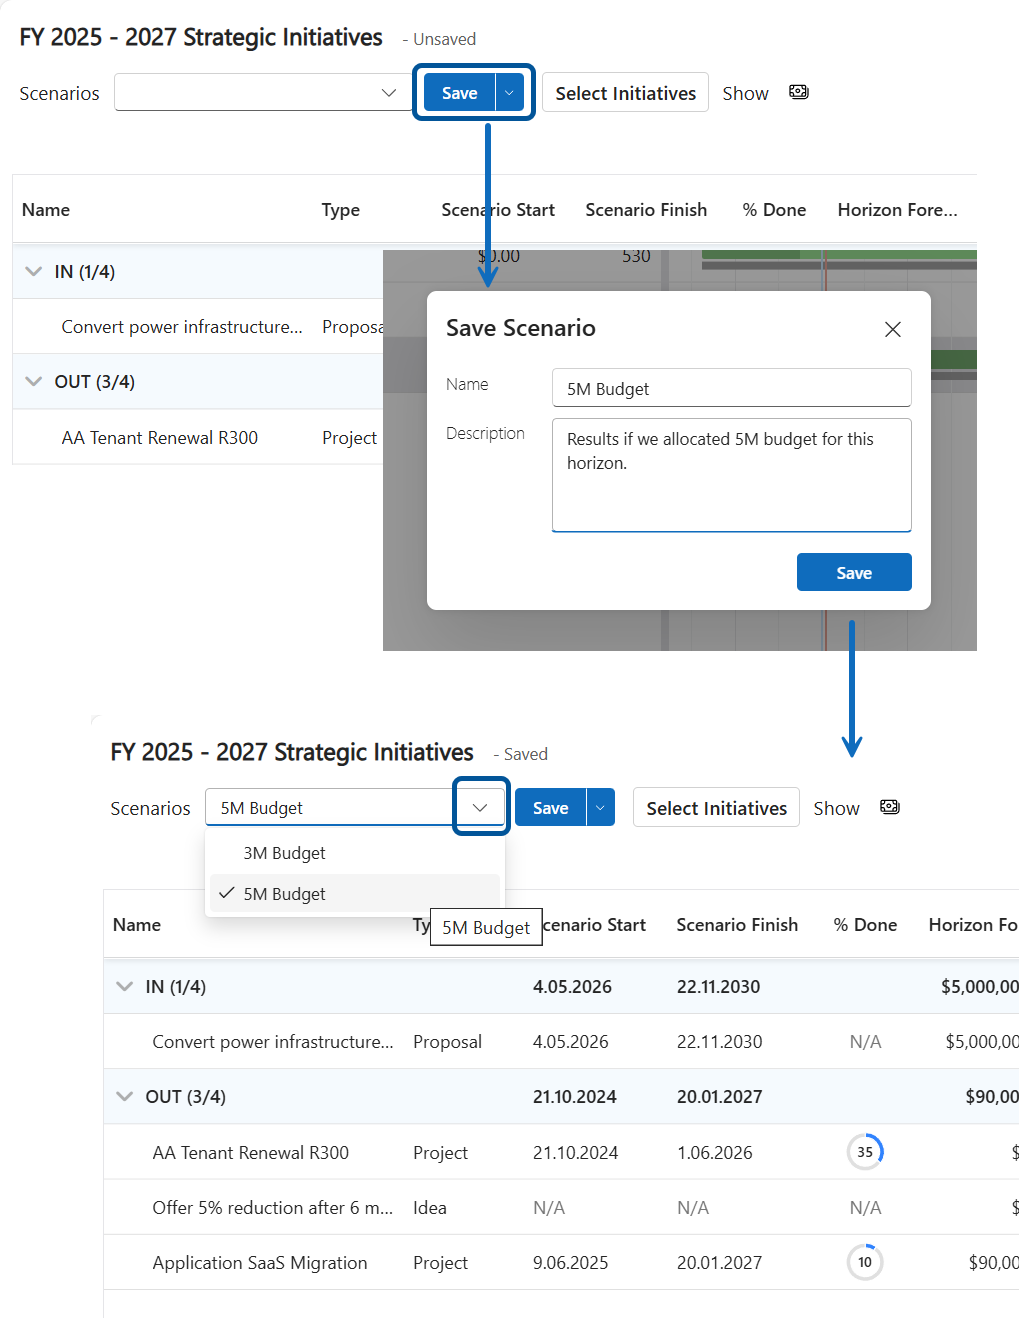
C. View, Copy, Delete and Compare Scenarios
- To view a Scenario, open the related Optimisation Plan and select the Scenario name.
- To switch between Scenarios, use the Scenarios dropdown menu.
- To copy an existing Scenario, select Save As… from the Save menu.
In your scenario you can include:
- Projects
- Proposals
- Ideas
- Any other Initiative type you have configured (see how to set up Initiative types).
- To delete a Scenario, open the Optimisation Plan, find the Scenario in the right pane, and click the Delete icon next to it. Confirm the deletion.
- You can compare up to five scenarios for any optimisation that has not yet been committed. You may continue adding scenarios even after entering the Comparison screen, provided the total number of scenarios remains below five.

D. Committing to an Existing Scenario
- Navigate to the plan you want to edit.
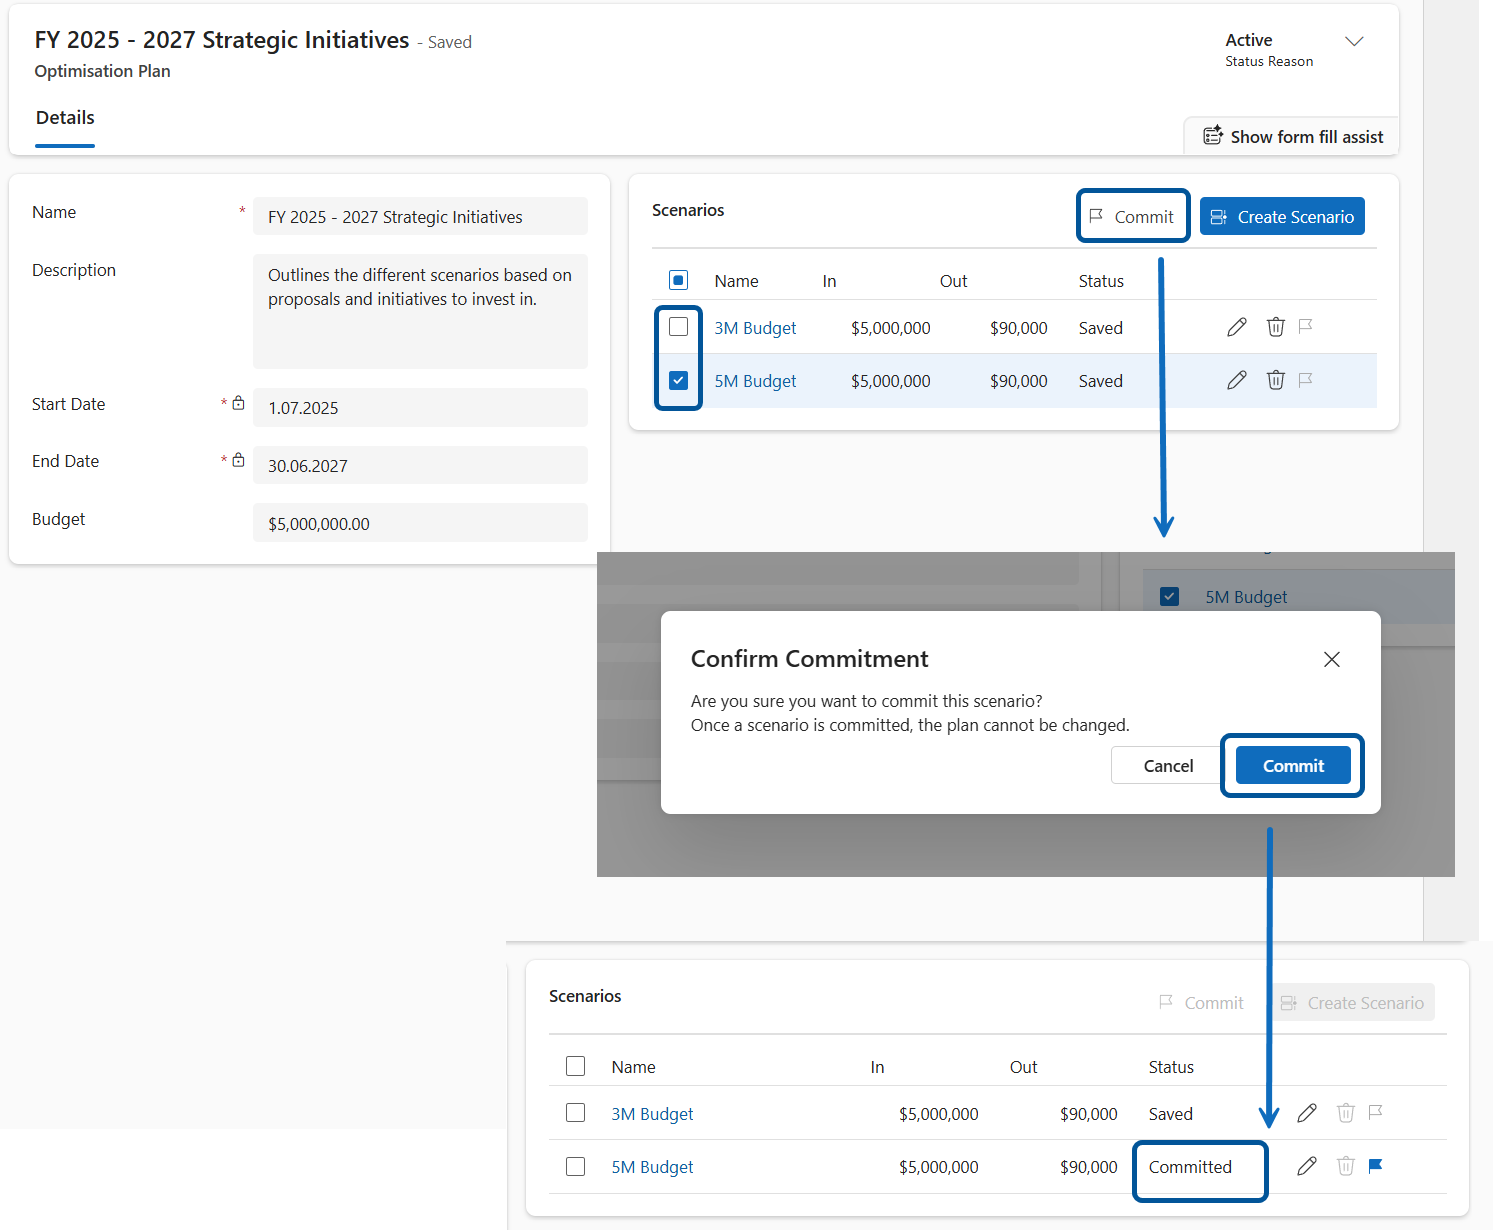
- In the Scenarios section, tick the checkbox next to the scenario your organisation has chosen to commit to.
Note: Only one scenario can be committed per plan. If multiple scenarios exist, select the one that best aligns with your decision-making process.
- When a Scenario is ready for approval, click Commit and follow the on-screen prompts to complete the process.
- Once committed, the scenario’s status will change to Committed and the Optimisation Plan will be locked so no further edits can be made.
Your organisation now has a formal record of the decision made through the optimisation process.
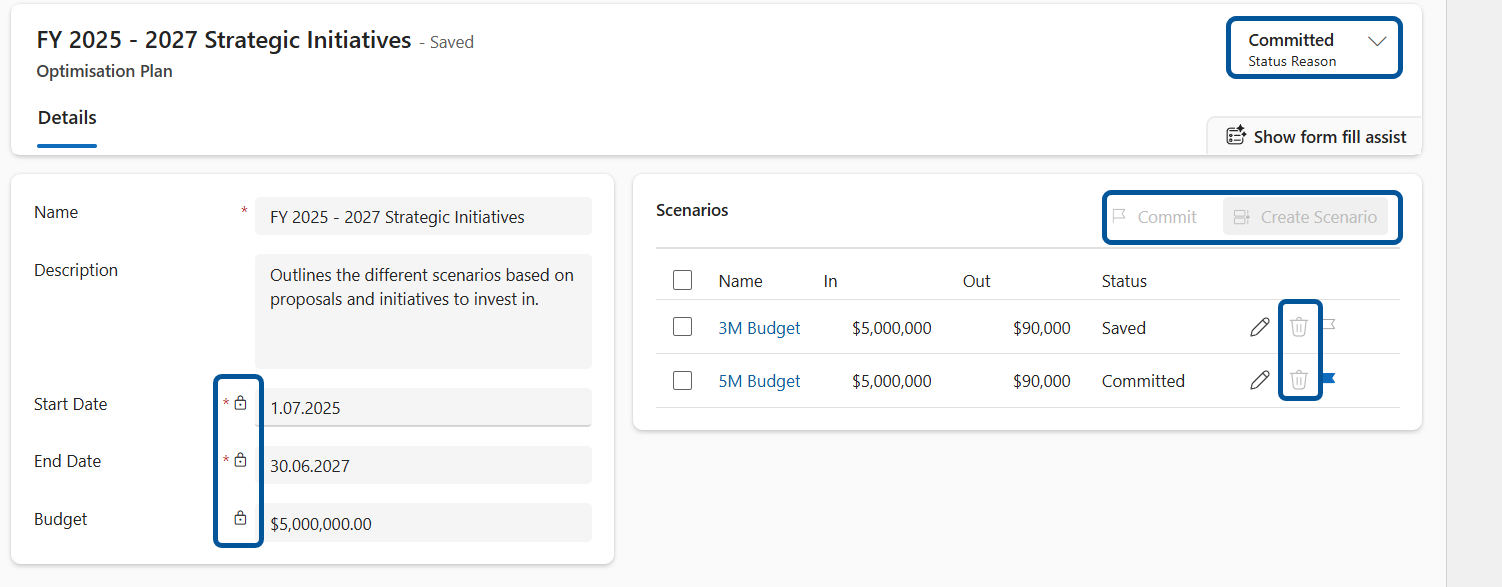
Important: After committing, you can trigger custom business processes (e.g., notifications or workflows) using Power Platform tools. These are not included out of the box but can be configured by your administrator or partner.An Optimisation Plan becomes read-only if:
- The plan is deactivated.
- The current user has read-only access.
- A Scenario within the plan has been committed.
In the case of a committed Scenario, if the underyling data for Selected Initiatives in the committed Scenario change (e.g. the dates or costs), then after viewing the Scenario (where those changes are automatically reflected), if the user selects to navigate away from the Scenario, they will be prompted to optionally Save those underlying changes to the Scenario. This is the only exception to the read only state of a Committed Scenario.
Interacting with Charts
- All charts support hover interactions. Moving your cursor over a chart displays additional details through tooltips.
- Financial Chart: Hover to view the financial forecast for the selected period.
- Forecast vs Impact Chart: Hover to see a holistic summary, including:
- Number of initiatives
- Forecast amounts
- Impact scores associated with the scenario
- Resource Chart: Hover to view the number of roles involved and the degree of overallocation.


Download PDF
A Download PDF option is available, allowing you to export the on screen visuals for reporting or record keeping.
