Drill-through Resources insights
Resources Insights provides a consolidated reporting experience for analysing workforce capacity, resource demand, utilisation, timesheet compliance, and resource-related financial performance.
The dashboard helps Resource Managers, PMOs, Team Managers, Delivery Leads, and Portfolio Managers make informed decisions about:
- Resource availability
- Capacity planning
- Resource demand
- Workforce utilisation
- Timesheet compliance
- Resource costs and margin performance
- Future resource requirements
Resources Insights combines supply, demand, utilisation, compliance, and financial information into a single reporting experience, helping organisations make proactive resourcing decisions based on real operational data.
Accessing Resources Insights
- Navigate to Resources.
- Select Insights.
The dashboard is divided into the following tabs:
- Resource Information
- Availability
- Timesheet Compliance
- Financial Analysis
Depending on your permissions and organisational configuration, additional reporting may also be available.
Resource Information
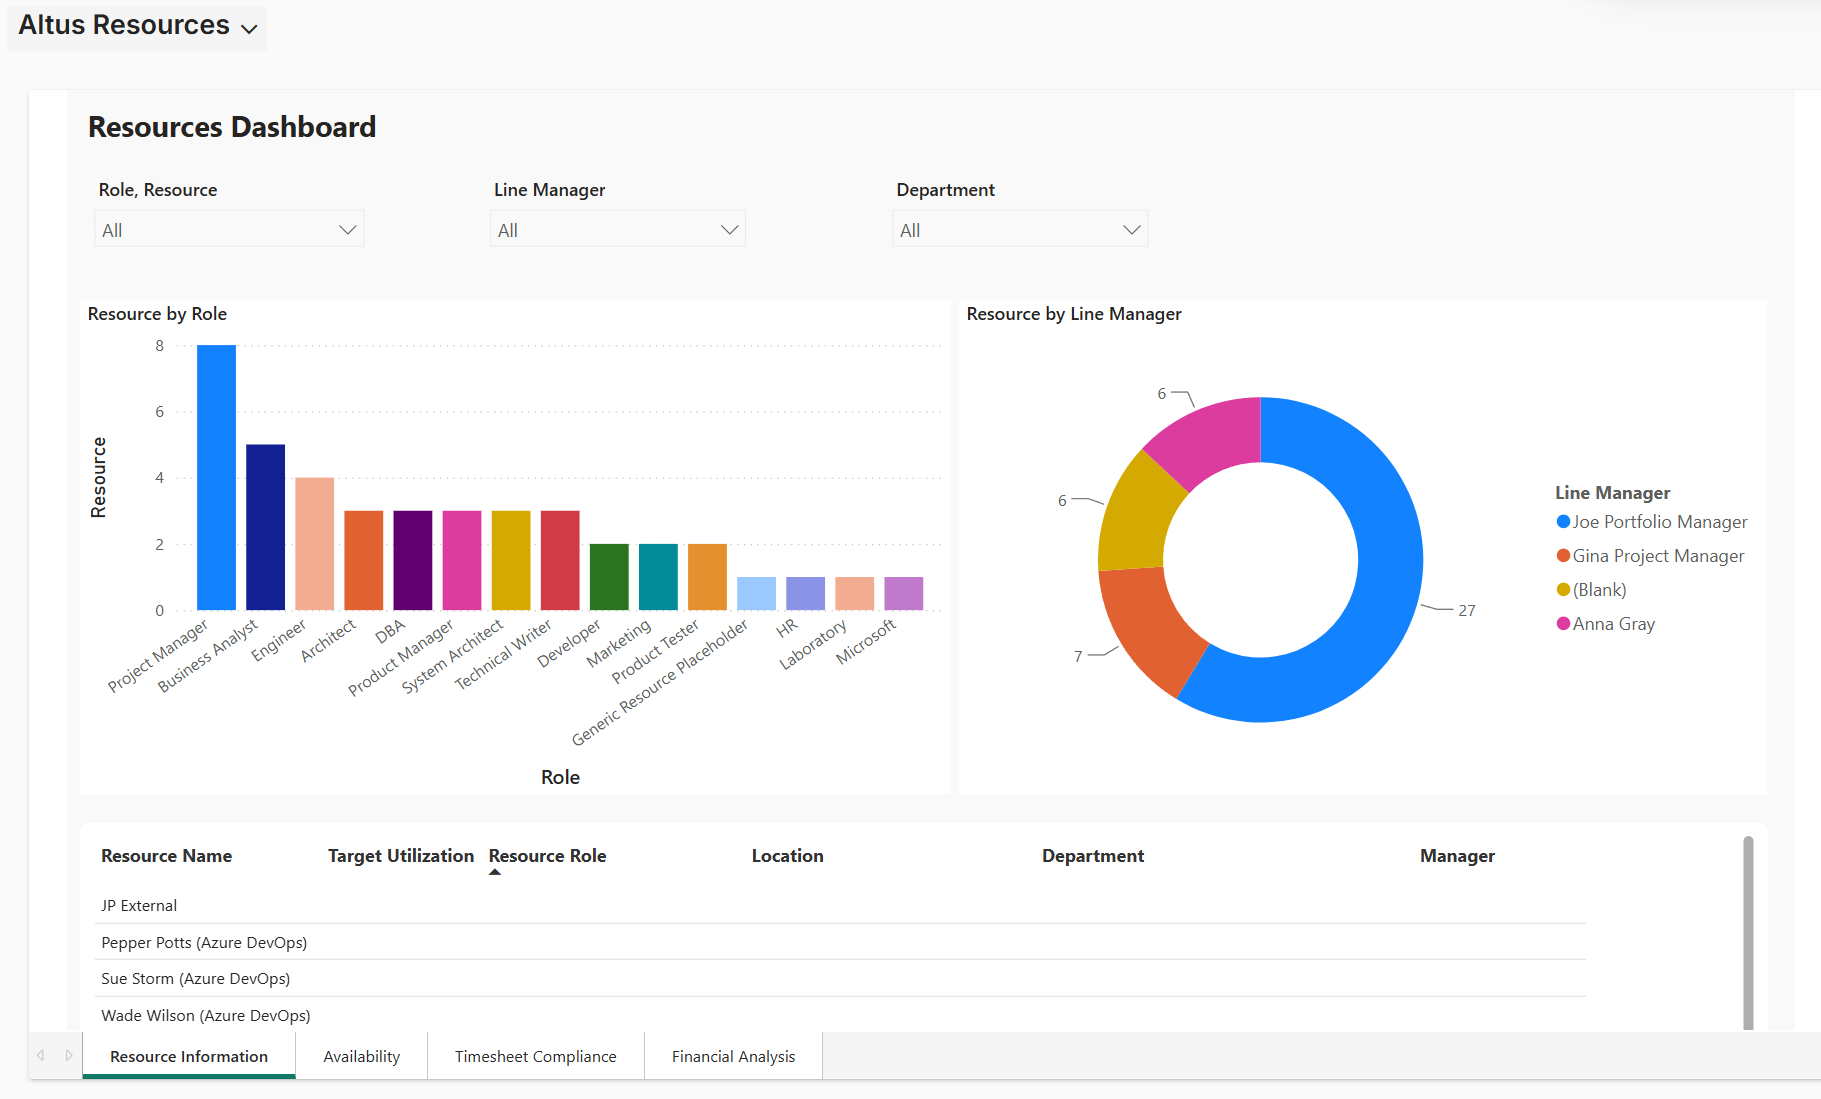
The Resource Information tab provides a centralised view of resource attributes and organisational structure.
This view helps organisations understand workforce composition and how resources are distributed across departments, roles, and management structures.
Available filters include:
- Role
- Resource
- Line Manager
- Department
The dashboard provides visibility into information such as:
- Resource Name
- Resource Role
- Department
- Location
- Line Manager
- Target Utilisation
Use this view to:
- Understand workforce composition
- Review resource distribution across roles
- Identify reporting structures and team ownership
- Review utilisation targets
- Support workforce planning activities
The visualisations include:
Resources by Role
Displays the distribution of resources across organisational roles.
This helps identify:
- High-demand skill groups
- Workforce mix
- Areas of resource concentration
Resources by Line Manager
Displays resources grouped by their line manager.
This helps provide visibility into:
- Team sizes
- Management distribution
- Reporting structures
Availability
The Availability tab provides capacity planning and resource allocation insights.
This view allows Resource Managers to compare current and future demand against available resource capacity.
Available filters include:
- Department
- Resource
- Resource Type
- Resource Request
- Line Manager
The dashboard supports analysis using:
- Hours
- Days
- Full Time Equivalent (FTE)
Use this view to:
- Review workforce capacity
- Identify resource shortages
- Identify available capacity
- Support resource allocation decisions
- Understand future demand trends
- Assist with resource planning activities
Resource Capacity and Requests
This chart displays:
- Resource Capacity
- Proposed Demand
- Committed Demand
- Draft Requests
across future reporting periods.
Use this information to determine whether sufficient resource capacity exists to meet current and future demand.
Hours Matrix
The Hours Matrix provides period-by-period visibility of:
- Availability
- Proposed Effort
- Committed Effort
for individual resources and resource groups.
This allows planners to review demand and allocation information at both an enterprise and individual resource level.
Important:
Resource availability calculations are based on configured calendars, working time, availability settings, and organisational capacity definitions.Availability indicators and utilisation thresholds may differ between organisations depending on local configuration.
Timesheet Compliance
The Timesheet Compliance tab provides visibility into timesheet completion and approval activity across the organisation.
Available filters include:
- Timesheet Manager
- Line Manager
- Resource
- Timesheet Status
- Timesheet Period
Use this view to:
- Monitor timesheet submission compliance
- Identify outstanding timesheets
- Monitor approval completion
- Support governance and audit activities
- Improve reporting accuracy
Timesheet Status
Displays a summary of timesheet status values such as:
- Approved
- Draft
- Other configured workflow states
This helps identify incomplete submissions and approval bottlenecks.
Project vs Non-Project Hours
Compares:
- Project Hours
- Non-Project Hours
recorded through timesheets.
This helps organisations understand how resource effort is being utilised across productive and non-project activities.
Timesheet Compliance Matrix
Provides period-by-period visibility of submitted timesheet hours by resource.
Use this view to identify:
- Missing submissions
- Incomplete periods
- Compliance issues
- Exceptional reporting behaviours
Financial Analysis
The Financial Analysis tab provides financial reporting derived from resource activity and timesheet information.
Available filters include:
- Project
- Timesheet Manager
- Line Manager
- Role
- Resource
- Timesheet Period
Use this view to:
- Understand labour costs
- Analyse sell rates
- Review resource margin performance
- Compare project and non-project effort
- Support financial reporting and forecasting
Timesheet Hours by Type and Period
Displays trends for:
- Project Hours
- Non-Project Hours
over time.
This helps identify changing workload patterns and effort distribution.
Cost, Sell and Margin Analysis
Displays:
- Resource Cost
- Resource Sell
- Resource Margin
across reporting periods.
This helps organisations:
- Monitor delivery profitability
- Review labour cost performance
- Understand margin trends
- Support commercial and financial planning
Financial Detail Grid
Provides detailed period-by-period information including:
- Project Hours
- Non-Project Hours
- Resource Cost
- Resource Sell
- Resource Margin
Use this information to investigate specific reporting periods and validate financial performance.
Using Filters
Most Resources Insights pages provide filters that can be used to narrow the reporting scope.
Common filtering options include:
- Resource
- Role
- Department
- Line Manager
- Project
- Timesheet Manager
- Timesheet Period
Applying filters allows reporting to focus on specific teams, resources, projects, departments, or reporting periods.
Tip:
Apply filters before performing detailed analysis to reduce noise and focus on the resources, projects, or departments most relevant to your review.
Key Considerations
- Resources Insights combines operational, planning, compliance, and financial information in a single reporting experience.
- Availability reporting compares resource capacity against proposed and committed demand.
- Resource availability is influenced by configured calendars and working time definitions.
- Financial reporting relies on the quality of underlying resource rates and timesheet data.
- Dashboard visibility depends on user permissions and organisational security settings.
- Filters affect the information displayed within the selected dashboard tab.
- Resource planning decisions should consider both current demand and future demand trends.
Tips
- Review Availability regularly to identify upcoming capacity issues.
- Use Resource Information to understand workforce composition and management structures.
- Monitor Timesheet Compliance to improve reporting quality and governance.
- Compare Proposed and Committed demand when reviewing fulfilment activities.
- Use Financial Analysis to identify cost, sell, and margin trends over time.
- Review future demand against available capacity before approving new work.
- Apply appropriate filters to focus on specific teams, projects, departments, or resources.
- Use Resources Insights alongside Resource Demand and Availability Heatmap processes for a complete view of workforce planning and utilisation.